Retrieved from: https://themeisle.com/blog/how-to-create-an-infographic/
To build your infographic, you will need to first sign up for Canva by creating a free account. You can sign up using your email or with your Google or Facebook account. Once you sign in, its time to learn how to create an infographic…
1. Choose an infographic template
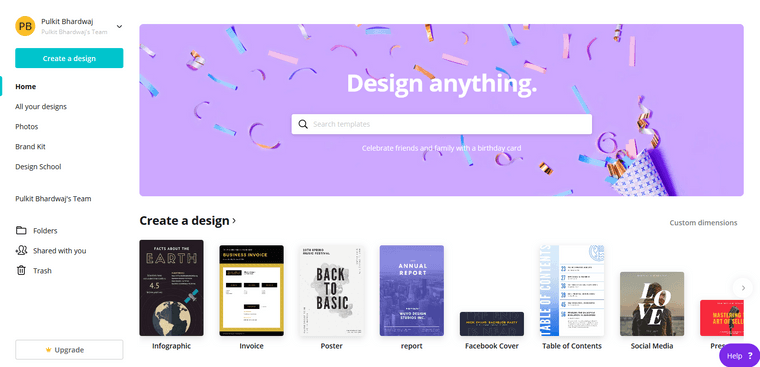
Once you’re logged into the editor, choose the dimensions of your final image. You can select a custom size, or choose from one of the pre-built templates. Search for “Infographics ” on the homepage. The default size for an infographic is 800 x 2,000 px.
2. Select your design style
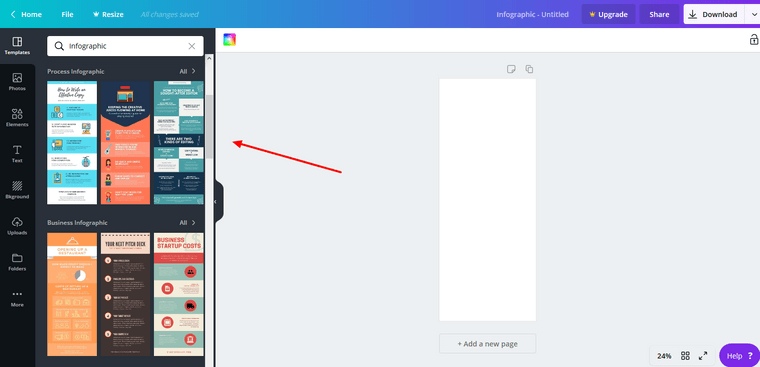
After you’ve chosen the right size canvas for your project, Canva rolls out a list of layout options that will serve as the base of your infographics. There are literally hundreds of designs to choose from, but the first 50 are typically the most customizable.
Canva offers both free and premium design templates, but the vast majority in this category are free to use. Each template has a variety of options based on the type of data being displayed, the visuals used, and the specific niche intended for the design.
With some browsing, you are likely to find a perfect template. No need to start from scratch.
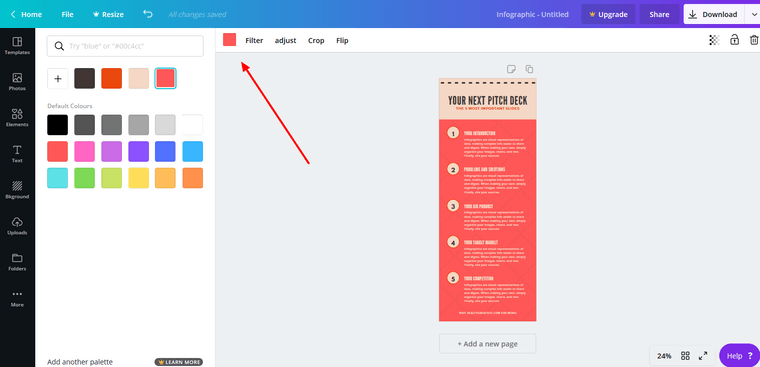
3. Customize the background and select fonts
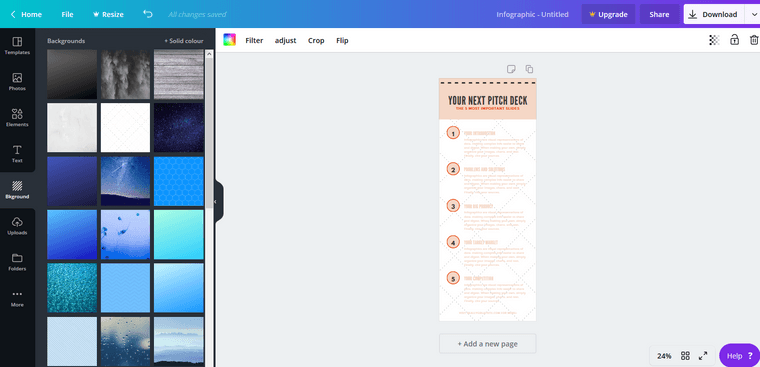
Now that you’ve selected a stunning template, it’s time to choose an eye-catching background. Canva provides unique infographic skins for free, and you can pick from a library of different patterns, colors, and design elements.
To change the background, click on the background icon in the left sidebar. The background options are sorted by color and include everything from solid colors and macro-photography, to quirky sketches and minimalist patterns. Choose one that aligns with your brand.
For the infographics you see here, I have selected a design from the “Education” category.
Changing color palettes is simple. Just click on the canvas, then click on the multi-colored box at the top of the design space. Use the search box that pops up to find a variety of relevant color schemes.
Canva offers 20+ different filters which you can apply to photos you find within Canva or images you upload from your personal stash. You can adjust brightness, contrast, X-Process, and saturation to get a sophisticated image that matches your website’s style.
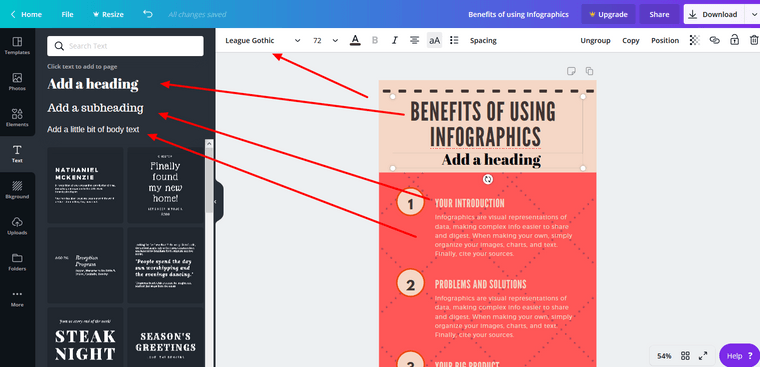
Add or change fonts in your graphic by selecting the text icon on the left side. Drag and drop the type of text you want to the canvas, remove the demo content, and start typing.
There are thousands of fonts to choose from in Canva. Select a font that works with your branding and the content of your infographics. Use the standard text editor features to fill out the details of your infographics.
Because the typography can be so dramatically customized, using certain fonts can affect your infographic’s template. Make sure you’re paying attention to the readability of the content.
4. Add graphical elements
The ease at which Canva lets you add graphic elements is a big reason why we decided to choose Canva for our ‘how to create an infographic’ guide. Infographics are so effective because they use powerful imagery to convey key data points. Be sure you’re picking relevant images to represent your info.
Canva has categorized its graphical elements into “images”, “grids”, “charts”, “frames”, “shapes”, “illustrations”, and “icons”. Under the “elements” tab, you will find an icon for just about every niche. To give you a feeling of the variety, we have created our infographics using some of the elements available in Canva.
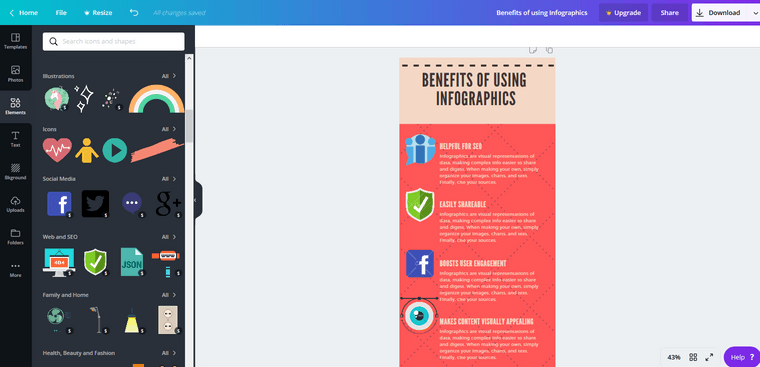
To select an element, double click on the type you want. You will find several styling options available for each type (“grids”, “icons”, etc.). Simply drag and drop the elements you like and resize to fit your design by dragging the corners.
If you’re looking for something specific, use the search box provided to filter the results.
5. Download your file
When you’ve settled on the perfect design for your infographic, click the download button to bring up a list of file types.
Adjacent to that button is the sharing option. Canva allows you to share your Infographics directly to social media platforms like Facebook and Twitter.
You can even use the embed tool to add your infographic to a guest post and boost user engagement. Sharing your content is an important step in generating brand awareness.
Conclusion
This was a quick guide to help you learn how to create an infographic with Canva. The tool is a super-effective way of generating highly-usable, engaging designs that increase the value of your digital content. With tools like these, producing powerful blog posts is simple and affordable.
Last modified: Monday, 14 June 2021, 6:57 PM